Developed by Takashi Inskeep with AI
troubleshooting assistance.
These projects are a sample of my recent work with React, as seen in my
GitHub Repository
(opens in new tab)
.
This interactive portfolio showcases three physics simulations built with React, demonstrating
mathematical programming, real-time animations, and advanced state management. Each simulation
explores different aspects of physics and astronomy through interactive visualizations.
Technical Skills Demonstrated
-
React Expertise: Advanced hooks (useState, useEffect, useRef, useCallback)
-
Mathematical Programming: Trigonometry, physics calculations, orbital mechanics
-
Performance Optimization: requestAnimationFrame, efficient state management
-
Component Architecture: Reusable components, prop handling, composition patterns
-
Animation Systems: Smooth 60fps animations, delta-time calculations
-
User Interface Design: Responsive controls, intuitive parameter adjustment
-
Physics Simulation: Collision detection, gravity systems, realistic motion
Technologies Used:
-
React 18 - Component framework and state management
-
JavaScript ES6+ - Modern JavaScript features
-
CSS3 - Animations, transforms, and responsive
design
-
HTML5 - Semantic markup and canvas-like
visualizations
-
Mathematical Libraries - Custom physics and orbital calculations
Physics Ball Bounce Simulation
 (opens in new tab)
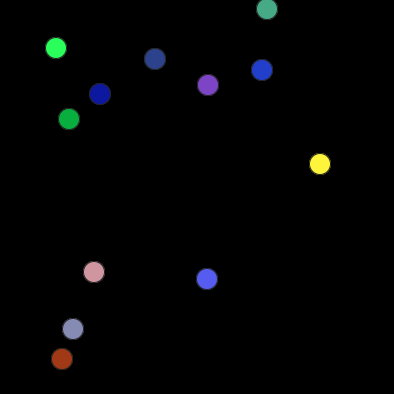
A multi-object physics engine featuring bouncing balls with realistic gravity and collision
detection. Each ball maintains independent physics while sharing global parameters.
Key Features:
-
Multi-ball physics simulation (12 independent objects)
-
Real-time gravity adjustment (0-1000 pixels per second squared)
-
Variable bounce elasticity (0-100%)
-
Realistic collision detection with boundaries
-
Random ball colors and initial velocities
Orbital Mechanics Simulation
 (opens in new tab)
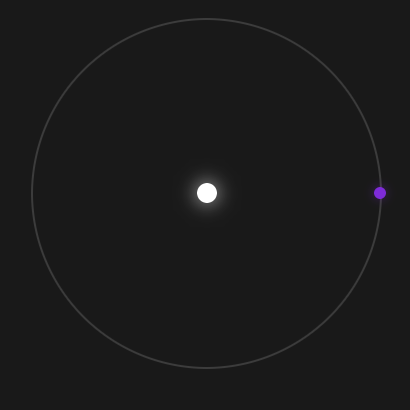
A physics-based demonstration of Kepler's Third Law showing the relationship between orbital
period
and distance. Features a planet orbiting a central star with adjustable orbital parameters.
Key Features:
-
Implementation of Kepler's Third Law (T squared proportional to a cubed)
-
Smooth animations using requestAnimationFrame
-
Real-time calculation display (period, radius, angular velocity)
-
Interactive orbital period adjustment
-
Dynamic orbit visualization that scales with distance
Planetary Ring System Visualizer
 (opens in new tab)
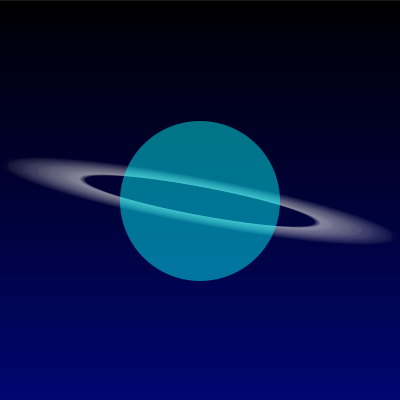
An astronomical simulation demonstrating how planetary rings appear from different orbital
perspectives. Users can adjust orbital inclination and watch real-time changes in ring
appearance as
viewed from a moon's surface.
Key Features:
-
Real-time orbital mechanics calculations using trigonometry
-
Interactive parameter controls with smooth animations
-
60fps performance optimization
-
Mobile-responsive touch controls
-
Mathematically accurate astronomical relationships
OTHER PROJECTS
These projects use HTML, CSS, and vanilla JavaScript to create educational
demonstrations of math
and science concepts.
 (opens in new tab)
What This App Is:
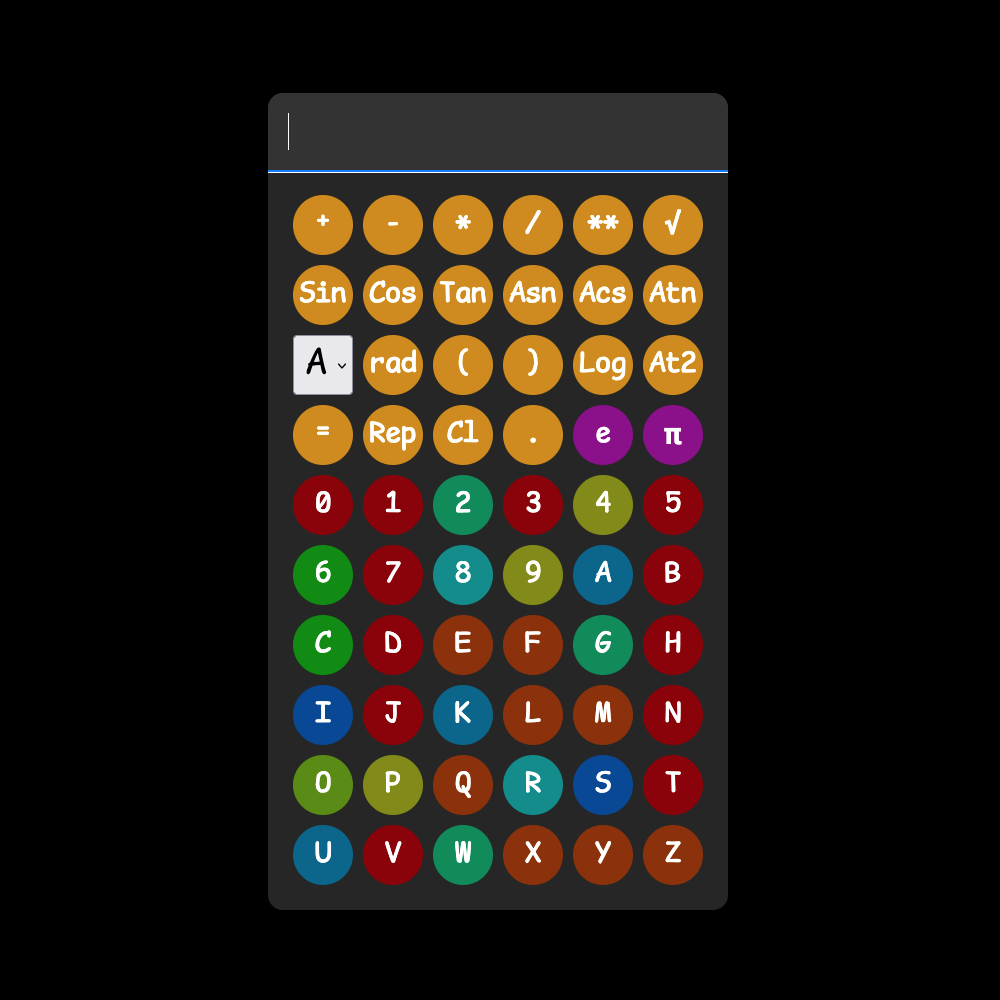
BaseCalc is a multi-base calculator that performs arithmetic operations in any numeric base
from 1
to 36, including binary, octal, decimal, and hexadecimal. Its color-coded interface visually
highlights the mathematical properties of each number: Prime numbers appear in dark red,
perfect
squares in yellow-green, powers of two in teal, and so on, making it both a powerful
calculation
tool and an educational resource for exploring number theory across different base systems.
How to Use It:
Select your desired base from the dropdown menu (bases 1-36, with "A" representing base 10),
then
enter numbers using the digit buttons or keyboard and choose an operation (+, -, *, /, **,
√).
Press the equals button (=) or Enter key to calculate, with results automatically displayed
in your
selected base. Advanced features include trigonometric functions (switch between degrees and
radians
with the "rad/°" button), custom base logarithms, mathematical constants (e and π), and full
keyboard support - use number and letter keys for digits, operator symbols for functions,
and
Backspace to clear.
 (opens in new tab)
What This App Is:
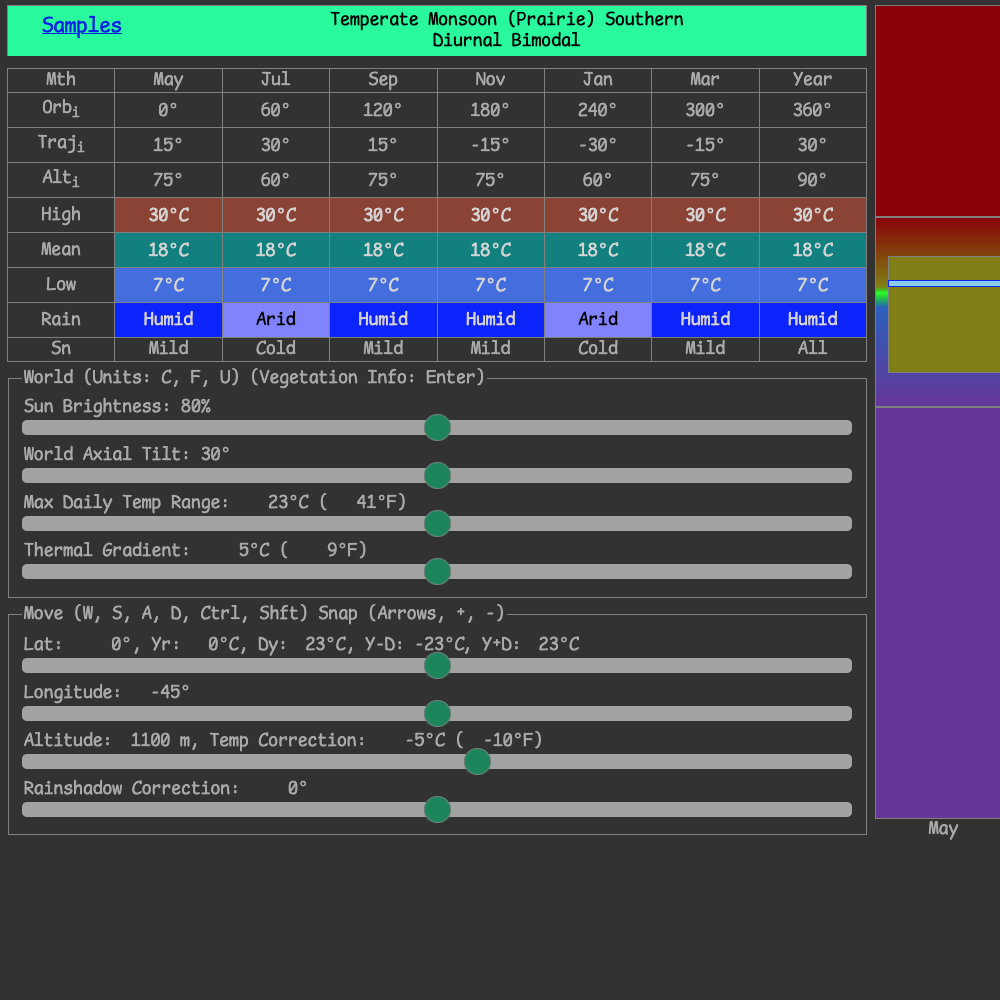
Climate: Base-06 is a climate visualization tool designed for worldbuilding. The app
generates
detailed climate data for any location on a fictional planet by simulating temperature and
precipitation patterns based on latitude, longitude, and altitude. It classifies climates
into nine
distinct types (Jungle, Savanna, Desert, Forest, Prairie, Canyon, Taiga, Heath, and Barren)
and
displays monthly temperature and precipitation data in an interactive chart. The tool
provides
information about seasonal patterns and temperature variations (both annual and diurnal).
How to Use It:
To use the app, adjust the sliders to your desired latitude (0 - 90°), longitude (-90 - 0°),
and altitude (0 - 2000 meters). You can also fine-tune parameters like base temperature,
temperature
range, and rainshadow effect using the additional sliders. The app responds to keyboard
shortcuts
for quick navigation: use W/S to adjust latitude, A/D for longitude, arrow keys for larger
jumps,
and Ctrl/Shift to change altitude in 100-meter increments. The climate chart updates in
real-time,
showing monthly temperatures and precipitation levels, while the display indicates your
climate
classification, hemisphere, and whether the climate exhibits more annual or diurnal
temperature
variation. You can toggle between Celsius and Fahrenheit using the 'c', 'f', or 'u' keys.
 (opens in new tab)
What This App Is:
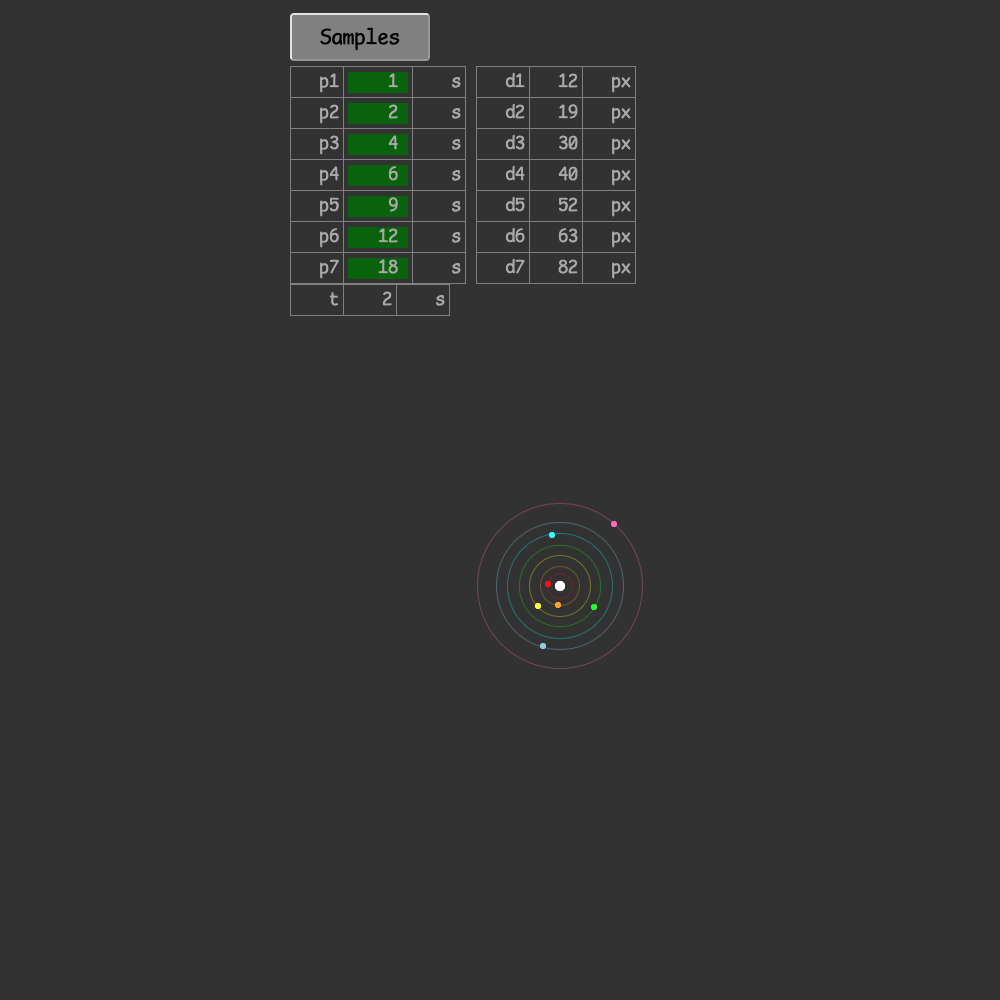
The Interactive Orbital Simulator is a physics-based visualization tool that demonstrates
celestial
mechanics and Kepler's Third Law of planetary motion. The app allows you to simulate up to
seven
orbital bodies (moons or planets) orbiting around a central host body, with each orbital
body
color-coded for easy tracking (red, orange, yellow, lime, cyan, skyblue, and hotpink). The
simulator
automatically calculates orbital distances based on the periods you input using Kepler's
Third Law
(which states that the square of an orbital period is proportional to the cube of the
orbital
distance), providing a scientifically accurate representation of how celestial bodies move
in space.
The visual display shows the orbits as translucent circles with the moons traveling along
their
paths in real-time.
How to Use It:
To use the simulator, simply enter the orbital period (in seconds) for each moon in the
input fields
labeled p1 through p7 on the left side of the display. The app will automatically calculate
and
display the corresponding orbital distances (d1-d7) in pixels based on Kepler's Third Law.
You can
control the simulation using the Play/Pause button to start or stop the animation, and the
Reset
button to return all bodies to their starting positions. The speed slider allows you to
adjust how
fast time passes in the simulation (1x to 100x speed), making it easy to observe longer
orbital
patterns. The current simulation time is displayed in the table on the right. To hide any
orbital
body, simply enter 0 or a negative value for its period, and both the moon and its orbit
will
disappear from the display.